Do you know what your users do after they interact with your OptinMonster campaign?
For instance, is there a difference between the behaviors of the users who view an optin versus the users who don’t? What about the behaviors of users who choose to optin instead of opting out?
You’re curious now, aren’t you?
In this guide, you’ll learn how to create a Google Analytics segment to analyze user behavior. We’ll walk you through the process step-by-step, and show you which reports are going to be your new best friends.
After that, we’ll share some tips on how to encourage the user behaviors you actually want.
What is Behavioral Segmentation?
Behavioral segmentation is segmentation based on patterns of behavior displayed by customers as they interact with your company. Essentially, it’s grouping customers by what they do, the actions they take when dealing they engage with your company and brand.
Segmenting customers by behavior offers 4 main advantages:
- Personalization. You can create custom offers for different groups of customers based on how those customers should be targeted.
- Predictive. It’s easier to predict and influence future customer behaviors and outcomes when you have historical behavior data.
- Prioritization. You’ll identify high-value customer segments and initiatives so you know where and when to invest your marketing dollars to get the greatest return on investment.
- Performance. You can track performance against goals over time by monitoring growth patterns and changes in key customer segments.
Segmenting by Behavior Using Google Analytics
You already track customer behavior in several ways. For example, whenever you look at any of these things you’re analyzing user behavior:
- Bounce rates
- Users that visited certain pages
- Users that visited pages in a certain order
- Users who stayed on your site a certain amount of time
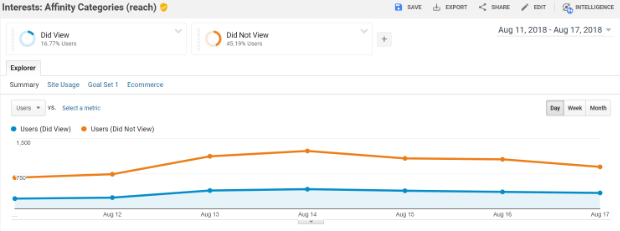
The list goes on and on. But what about the behaviors of users who are, due to split-testing, shown a particular optin campaign on your site versus the users who aren’t? What do their behaviors tell us?
Let’s find out.
Before we get started, you’ll want to make sure you have your Google Analytics added to your OptinMonster campaign.
Step 1. Create a Segment
Sign in to your Google Analytics account and open the View whose data you want to analyze.
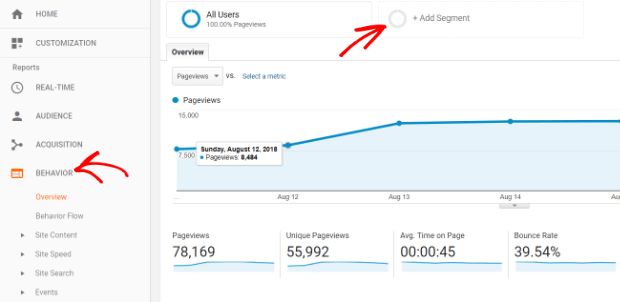
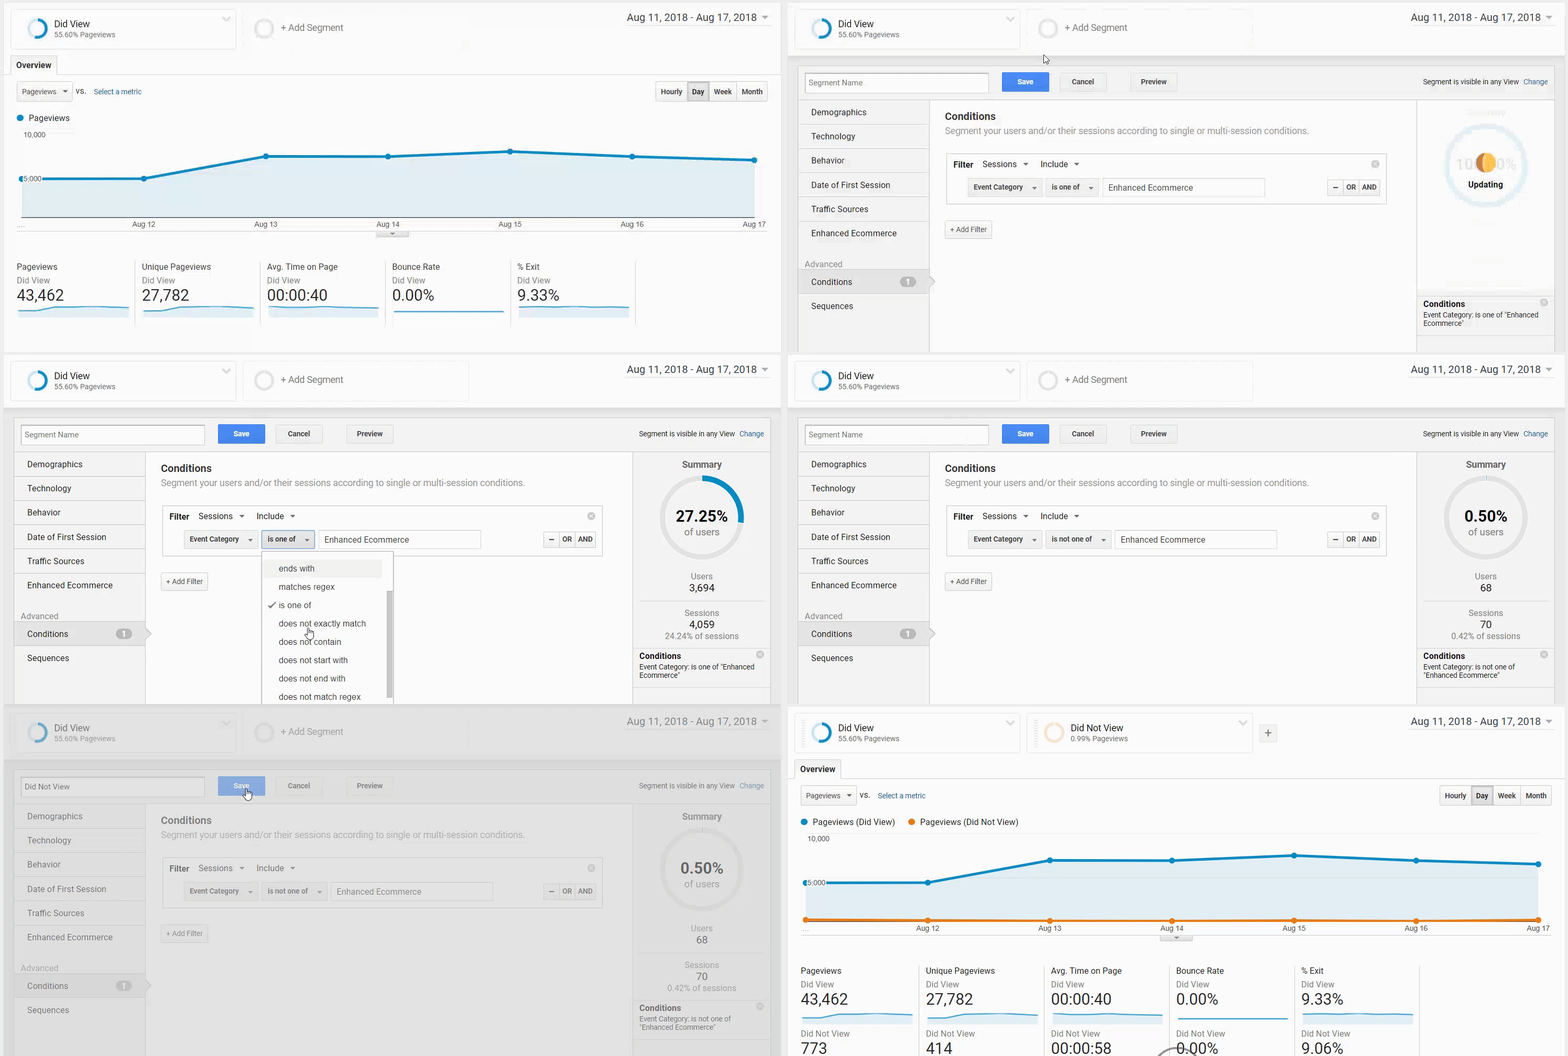
Go to Reports » Behavior Overview and click +Add Segment. You can select any report grouping, we just chose to go to this one.
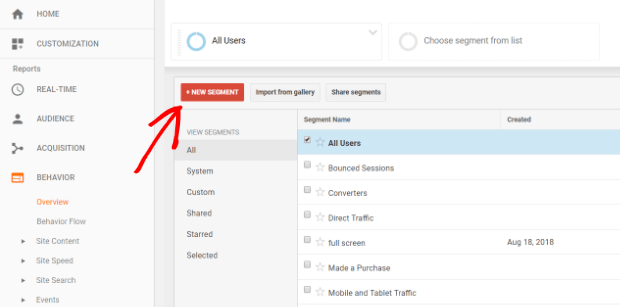
This will bring up a list of possible segments. We want to click the red + New Segment button to create a new segment.
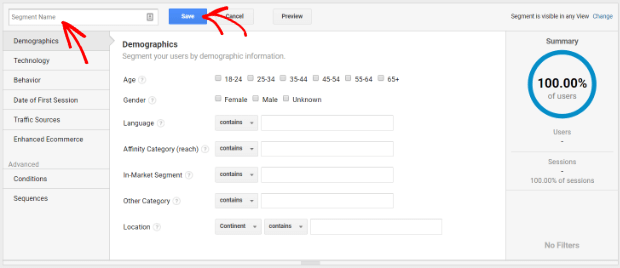
From here, you have countless ways to segment your site visitors to fine-tune your analysis. Be sure to name your segment and Save it!
Google Analytics WordPressAdd Google Analytics to WordPress to keep your finger on the pulse of everything on your site—content and eCommerce!
Step 2. Add Options and Filters
We know that we need at least one segment because we want to track the behavior of visitors who view a particular optin, so let’s go ahead and add the options to build out that segment.
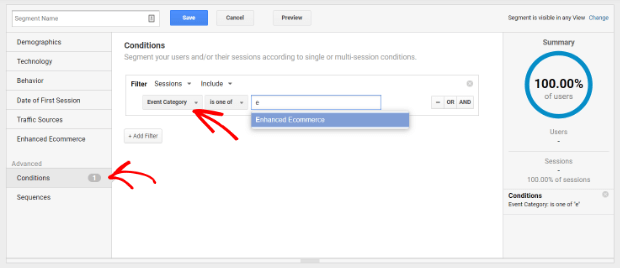
To do that, click on Conditions and select Event Category is one of from the dropdowns in the center. Then, start typing your campaign name in the text field and select it from the list that appears.
Click Save and you’ll see the reporting for your segment which consists of visitors who have viewed your selected campaign.
Step 3. Duplicating a Segment
Now, do the same thing for visitors who haven’t viewed the campaign. To do that, you can easily duplicate the segment we already created from the screen that appeared when you saved it.
Just click on the downward arrow to the right of the campaign name you want to copy and select Copy. Give it a new name, enter your conditions, and click save. Your report will populate with data from both segments.
Understanding the Data
Now that you have the data at your fingertips, what do you do with it?
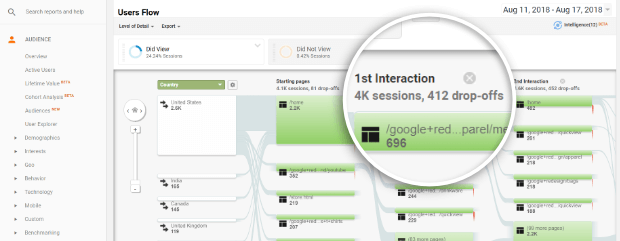
For starters, check out some of the Flow reports from Google Analytics. These literally tell you how the users flowed on your site based on how you want to view the data. You can also see where the users dropped off.
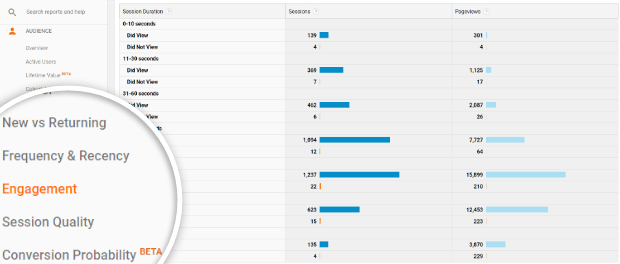
There are also other ways of looking at behavior for your segments.
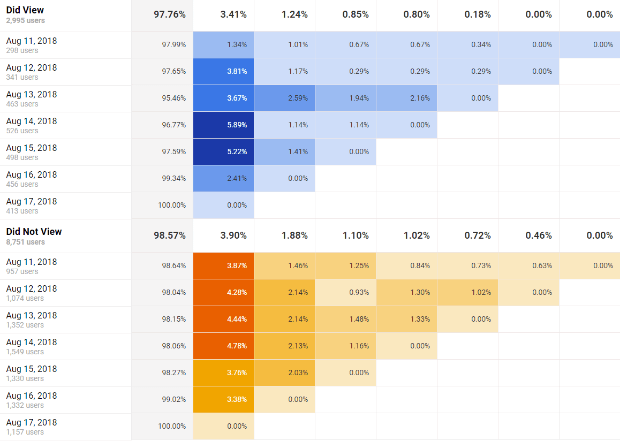
There’s also this really cool thing called Cohort Analysis in the Audience section that lets you track by User Retention, among other measures. This analysis works well with segments and allows you to identify at what rates you lose users so you can better understand the growth rate you need for your business.
This also allows for a faster response to short-term marketing efforts like single-day email or optin campaigns and lets you track the behavior of just the users you gained from those efforts.
There you have it! Google Analytics and OptinMonster together are a wonderful and powerful thing. If you haven’t started using Google Analytics to track your OptinMonster conversions, check out this step-by-step guide.
Already got that going on? Cool. Then let’s talk about how you can get actionable insights with a custom Google Analytics dashboard.
If you run your site on WordPress you should definitely add MonsterInsights into the mix; you’ll love being able to track your analytics without having to leave WordPress.










Add a Comment