Do you really understand your visitors’ behavior on your website? If you don’t, you’re not alone, but you’re missing out on key insights you need to improve your business. A custom Google Analytics dashboard can help.
Like most people, you’re probably using Google Analytics as a single tool to track website data, but if you want to gain real insight that’s meaningful for your business, you’ll want to use a custom Google Analytics dashboard that’s tailored to your needs.
By the end of this guide, you’ll understand why Analytics dashboards are important and how to create a Google Analytics dashboard of your own so you can improve your website and your business.
Why You Need a Custom Analytics Dashboard
Let’s backtrack a little bit to the importance of analytics. Everything these days is data-driven. By planning your website and marketing strategy on real data, you can ensure you’re doing what works, and not wasting time on tactics that don’t get the results you need.
That’s where Google Analytics comes in. Google Analytics is a free tool to track what visitors do on your site. That information can help you tweak and improve your site to build better customer relationships and earn more revenue.
With the addition of a snippet of code, Google Analytics can help you:
- Understand who your audience is by providing data on demographics, location, interests, technology and more.
- Explore how visitors typically move through your website, which is called user flow.
- Know how your content is performing and how people are sharing it.
- Analyze website conversions so you know if your marketing is working.
That’s just the beginning because Google Analytics is an incredibly rich tool. You can even track the performance of your optins with Google Analytics. We’ll show you how later in this article.
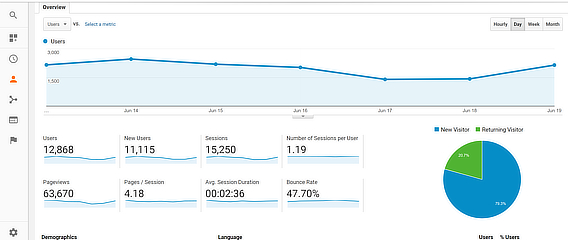
One way to visualize the data Google Analytics collects is with a dashboard, which is a page that gives an overview of your data. Dashboards are built into Google Analytics, as each section has an overview showing the metrics Google thinks are important.
Since dashboards are built-in, you might be wondering if you need a custom Google Analytics dashboard. We think you do, and here’s why: you know better than Google what website data really affects leads, sales and revenue in your business.
Custom dashboards allow you to unearth and display information about your web visitors that may not be part of the standard dashboards. Using a custom analytics dashboard will simplify data visualization, showing key website metrics related to your business at a glance.
Before we get started with our Google Analytics tutorial, there are a couple of key terms you’ll need to understand.
What is a “Metric” in Google Analytics? Key Terms
Metrics are quantities, like the number of pages people visit.
Dimensions describe the attributes of your data like the city visitors are from, the browser they are using and so on. Google Analytics even allows you to add your own custom dimensions.
Metrics and dimensions are important because you use them to create Google Analytics dashboard widgets. Widgets are the building blocks of custom Google Analytics dashboards. Each widget is a micro-report on an aspect of your data.
How many reporting widgets can you save to a dashboard in Google Analytics? You can have up to 12 widgets on each custom dashboard, 20 private dashboards per analytics view, and 50 shared dashboards per analytics account. That adds up to a lot of ways to visualize your data.
Before creating a dashboard, think about the kinds of metrics and dimensions you want to track. That’ll help you when you’re ready to create widgets and add them to a dashboard.
As you’ll see, people create dashboards to collect metrics on eCommerce, content effectiveness, search engine optimization (SEO), mobile performance and more. You’ll know which metrics are most important to you, and remember, you can always create more dashboards.
Getting Started with Analytics Dashboards
There’s one thing to take care of before you get started with Google Analytics dashboard creation. Just as you do for all Google products, you’ll need a Google account to create a Google Analytics account.
Once you have that, you’ll need to add the site you want to track, known as a web property in Google-speak. Check out our tutorial on how to set up Google Analytics in WordPress that covers these initial steps.
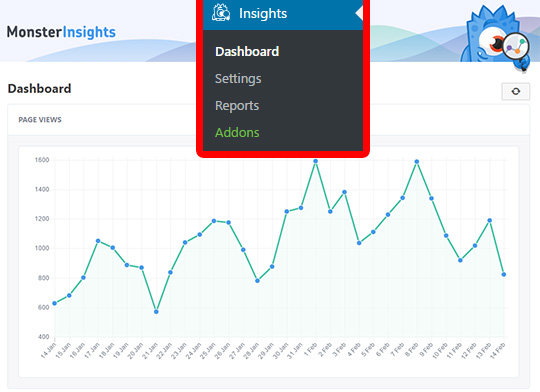
By the way, if you’re looking for an easy way to keep track of Google Analytics data right in your WordPress dashboard, MonsterInsights can help.
You can monitor page views, top posts and pages, traffic sources, and countries, and keep track of the performance of mobile content, ads and eCommerce metrics. Here’s how you get started with connecting Google Analytics and MonsterInsights.
Now let’s look at how you create a Google Analytics dashboard. You have three options:
- Using a starter dashboard.
- Grabbing a Google Analytics dashboard from Google’s Solutions Gallery.
- Creating a Google Analytics dashboard from scratch, which is suitable for more advanced users.
How to Create a Starter Dashboard
A good way to get started with Google Analytics dashboards, especially if you’re new to Google Analytics, is to use a starter dashboard. That’s a custom dashboard that already includes widgets for key website metrics.
Here’s how you create one:
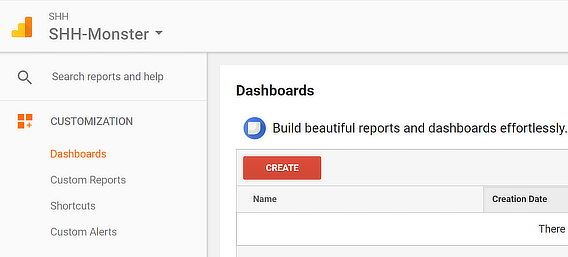
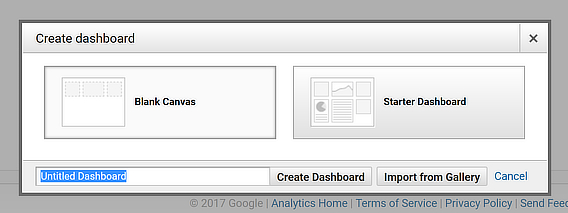
When you’re logged into Google Analytics, click on Customization » Dashboards in the left sidebar, then hit the Create button.
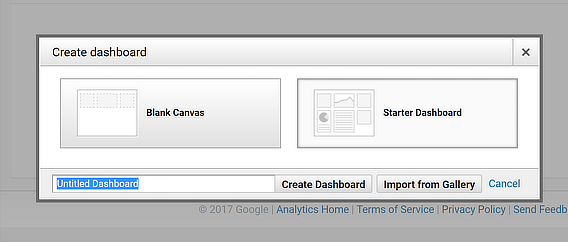
Click on Starter Dashboard on the right, and give the dashboard a name in the highlighted box below.
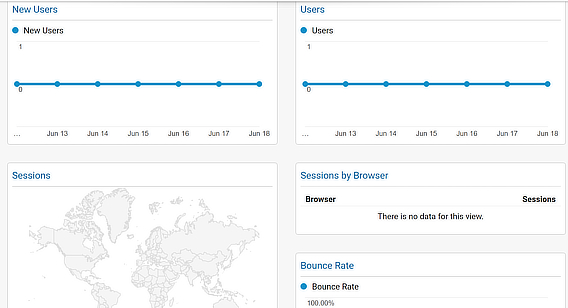
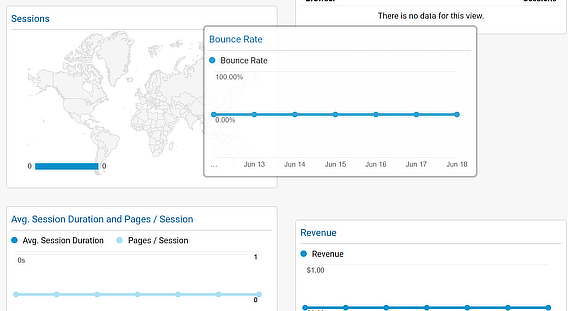
Click the Create Dashboard button. Google will automatically create a dashboard for you with the following widgets: new users, users, sessions, sessions by browser, average session duration, and pages per session, bounce rate, goal completions, and revenue.
The widgets give a snapshot of your data, but you can access all the data by clicking on a link in the widget’s title bar. This will give you an immediate overview of those metrics and dimensions for your website.
Once the dashboard is created you can use drag and drop to change the position of the widgets and can delete any widgets you don’t need. To delete a widget, hover over the widget title, and click on the X that appears in the top right.
How to Edit Google Analytics Dashboard Widgets
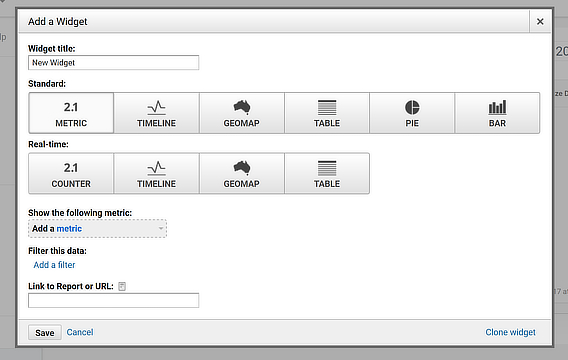
You can also edit individual widgets. To do this, hover over any widget till you see the pencil icon at the top right.
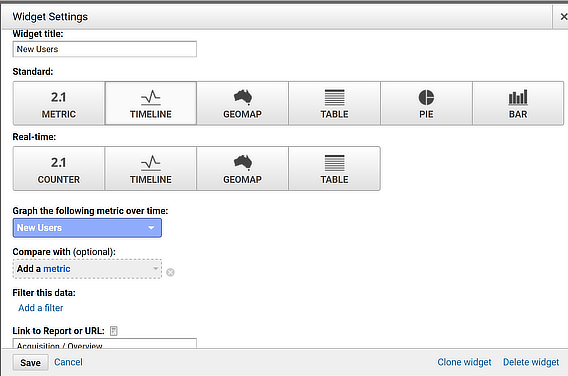
Click it and you’ll enter the editing interface. As well as changing the name, you can change the data shown in a widget. For example, you can choose:
- Whether the widget displays real-time data or standard data, which is up to the previous 24-hour period.
- The type of chart (2:1, timeline, map, table, pie chart or bar chart).
- The metric that’s shown, and you can add a comparative metric, too.
- Data filters, including adding dimensions.
- The Google Analytics report or URL the widget links to. Just start typing to see the available options.
You can also use the edit interface to clone or delete widgets to further customize your Google Analytics starter dashboard.
How to Use the Google Analytics Dashboard Gallery
Another option for creating a Google Analytics dashboard is to import one from the Google Analytics Solutions Gallery. Here’s how you do that:
When you’re logged into Google Analytics, click on Customization » Dashboards in the left sidebar, then hit the Create button.
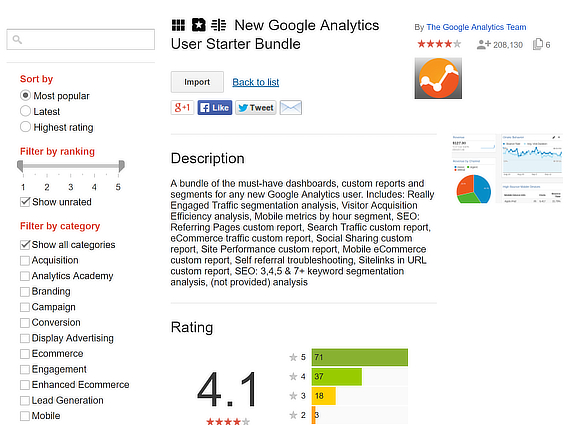
Click on Import from Gallery on the right. The Solutions Gallery will load and you’ll see some of the most popular options.
Use the search box at the top of the page to find the dashboard you want. You can sort dashboards according to popularity, rating and recency.
Click on the title of the analytics dashboard you’re interested in. A description will pop up. There are also icons to show whether what you’re looking at is a dashboard, custom report, goal or segment, which are all different ways of viewing your data.
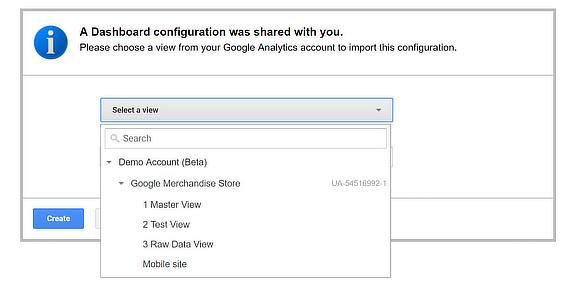
Click on the Import button on the left to add the dashboard to your Google Analytics account. A window will pop up showing more details of the report and asking you which view to import it to. You can also edit the name of the dashboard at this time.
Hit Create to add the dashboard to your account. After that, you can move widgets around and edit them as described earlier.
How to Make an Analytics Dashboard from Scratch
For most people, using a starter analytics dashboard or importing a dashboard from the Solutions Gallery provides more than enough choice, but if you want to have full control over how you analyze and display your data, you can also create your own dashboard from scratch. Here’s how you do that:
When you’re logged into Google Analytics, click on Customization » Dashboards in the left sidebar, then hit the Create button.
Click the Blank Canvas button, give your dashboard a name, then click Create Dashboard. That brings up the widget creation interface we saw earlier when we talked about editing widgets.
Click the buttons to select the type of chart, whether you’re using standard or real-time reporting, and what metrics and dimensions you want to include. Depending on what you select, the widget title may change, but you can also edit this manually.
Hit Save to add it to your new dashboard.
Click on Add Widget in the dashboard to create and add new widgets. Don’t forget that you can also use the Clone feature in the widget creation interface.
When you create your own dashboard, there are endless possibilities for viewing your data. For example, we wanted to set up a widget to track the completion of OptinMonster campaigns on a site.
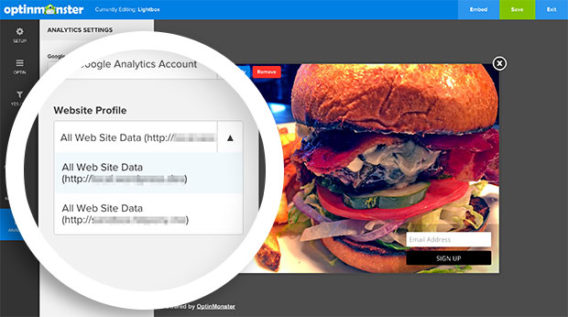
Since OptinMonster already uses Google Analytics for measuring conversions, this was pretty simple. Here’s how you connect your OptinMonster account with Google Analytics to enable conversion tracking.
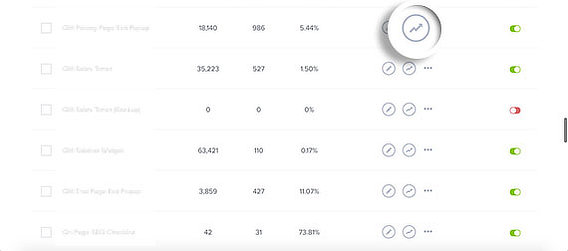
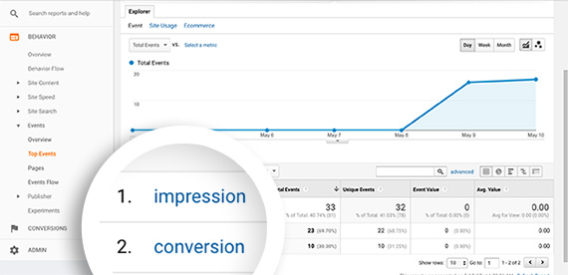
You can see OptinMonster data in Google Analytics by going to Behavior » Events » Overview, then viewing the top events. There’s data for both conversions and impressions. And you can also create OptinMonster event goals in Google Analytics.
While OptinMonster lets you see conversion data in your OptinMonster dashboard, sometimes you’ll want to see that data when you’re in Google Analytics.
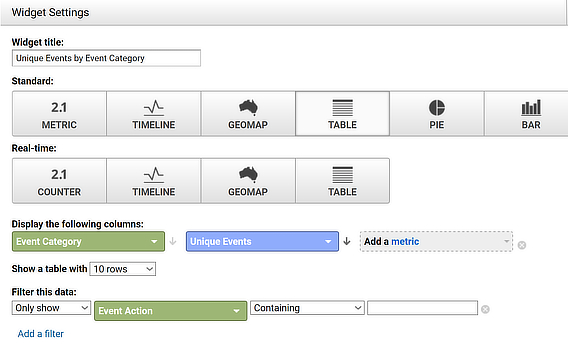
Here’s how we set up a widget to track the completion of OptinMonster campaigns on a site. We wanted to track unique events in a table format, so those are the parameters we set:
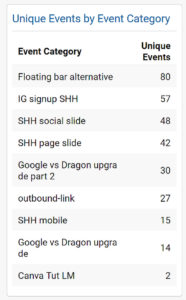
And here’s how the widget looked. It includes the names assigned to each campaign, plus the number of events:
You can also share your dashboards as a template or via the Solutions Gallery from the top of the dashboard.
How to Get Pre-Made Dashboard Templates
One great feature of Google Analytics is the ability to build different dashboards for different purposes to make reporting easy. Since so many people have done this already, you don’t even have to create them yourself.
But if the idea of sorting through thousands of dashboards and reports makes you nervous, then check out the dashboards from:
Many of these are also available via the Solutions Gallery, but if you’re logged into Google Analytics, you can simply click the links in the articles to add them to your own account immediately.
Now you know how to create a Google Analytics dashboard that can help you track optins and even the success of your email marketing strategy.
Wondering how else you can use Google Analytics to improve your marketing? Check out our guide on how to use Google Analytics to discover ideas for lead magnets.
Want to know how people behave on your website when they see or interact with your OptinMonster campaigns, as compared to other visitors? It’s easier than you might think! Check out our tutorial on How to Analyze the Effects of OptinMonster Campaigns on User Behavior.
Don’t forget to follow us on Twitter and Facebook for more in-depth tutorials and guides.






Add a Comment